

Canetti // Shutterstock
Counties with the best commutes in Tennessee
Stacker compiled a list of the counties with the best commutes in Tennessee using data from the U.S. Census Bureau. Counties are ranked by the shortest average travel time to work, with ties broken by lowest percent of residents that commute over 60 minutes, and any further ties broken by lowest percent of residents that work outside the county of residence.
Canva
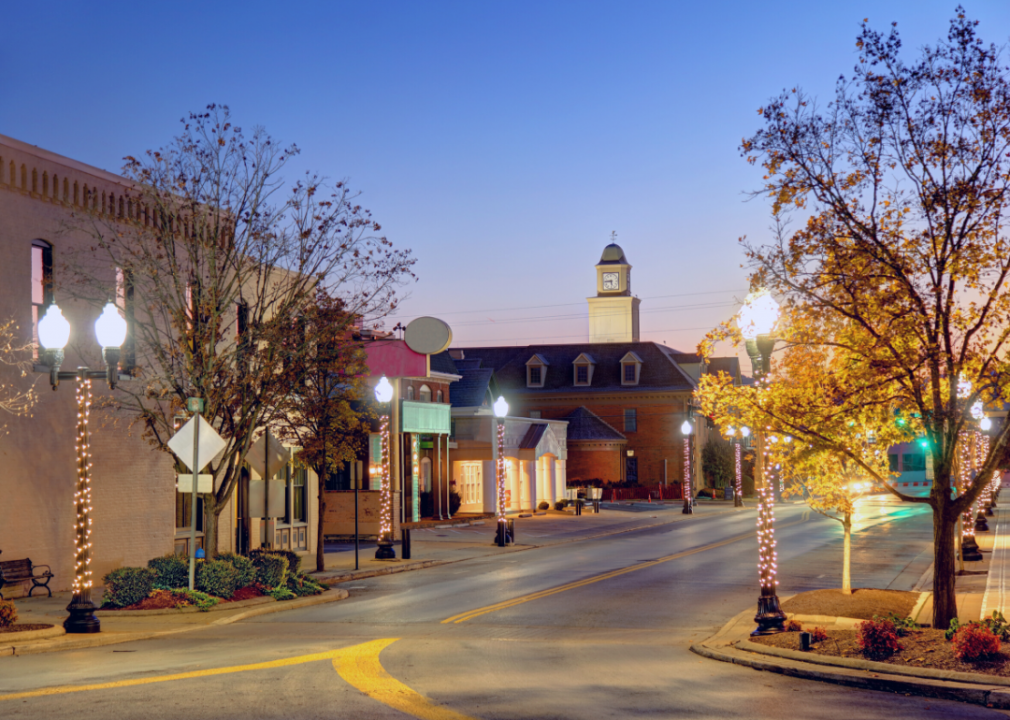
#50. Williamson County
- Mean travel time to work: 27.8- Workers with 60+ minute commute: 5.9%
- Worked outside of county of residence: 32.6%
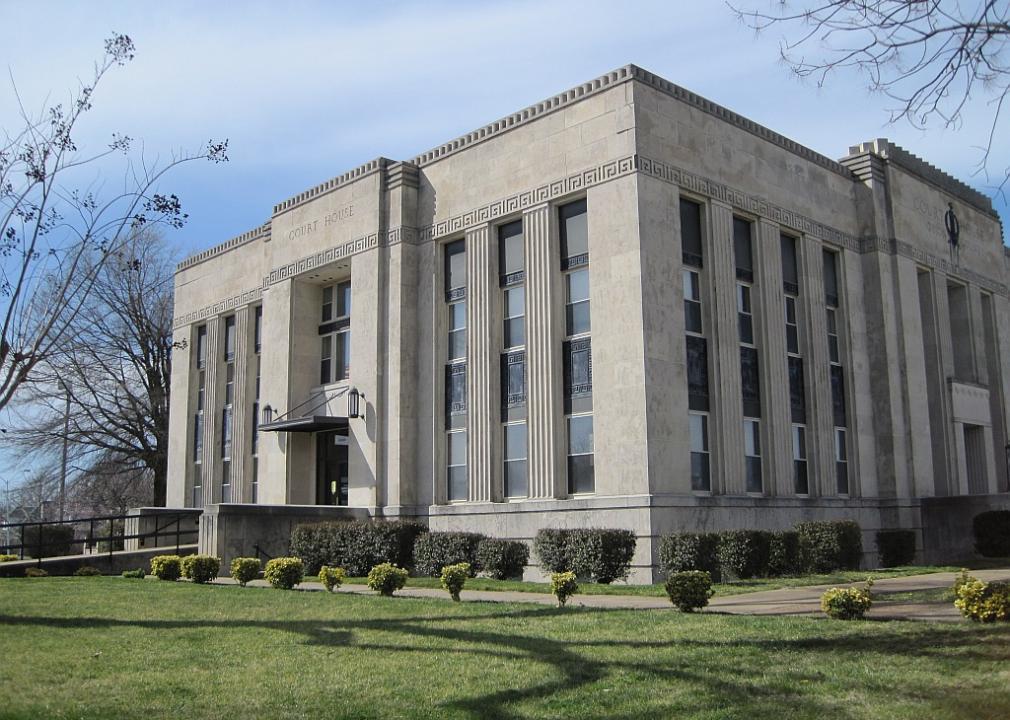
Brian Stansberry // Wikimedia Commons
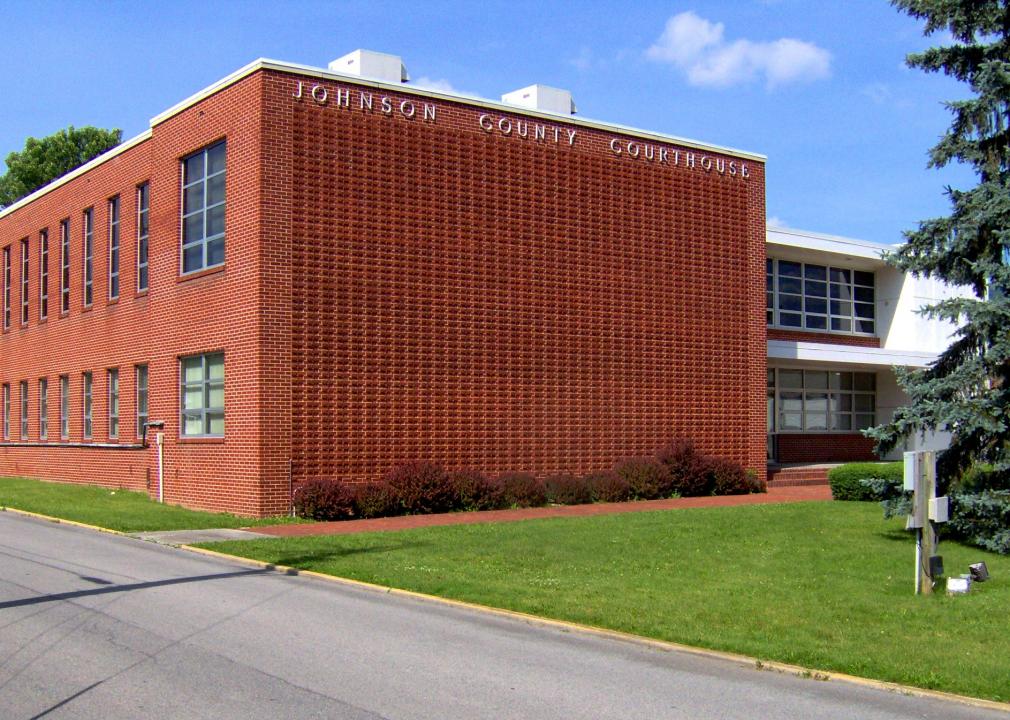
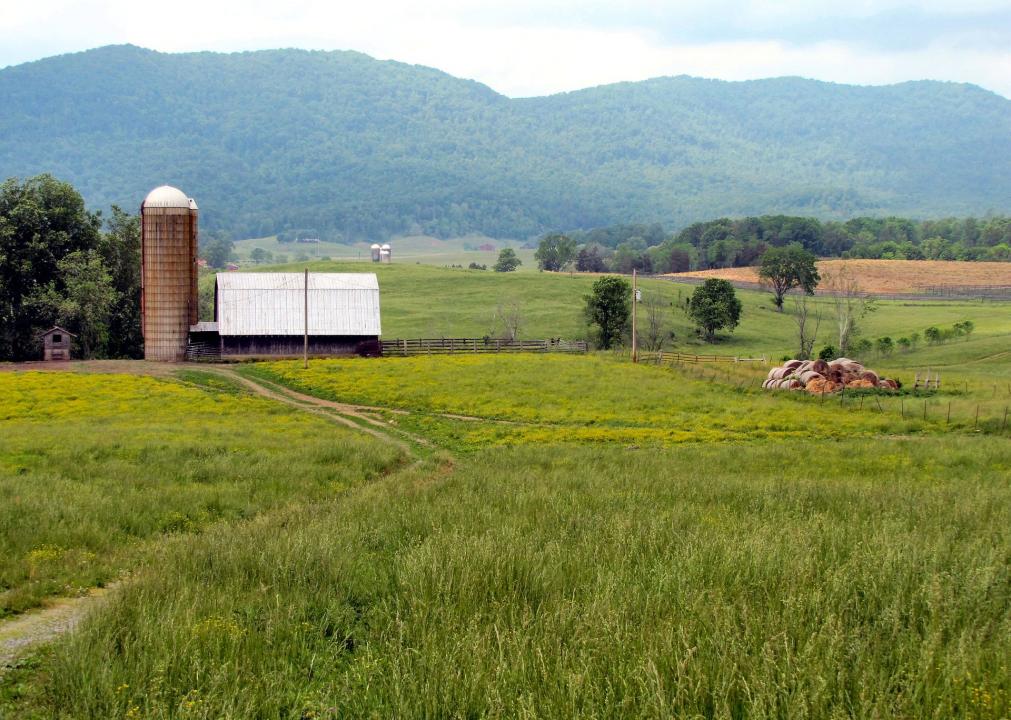
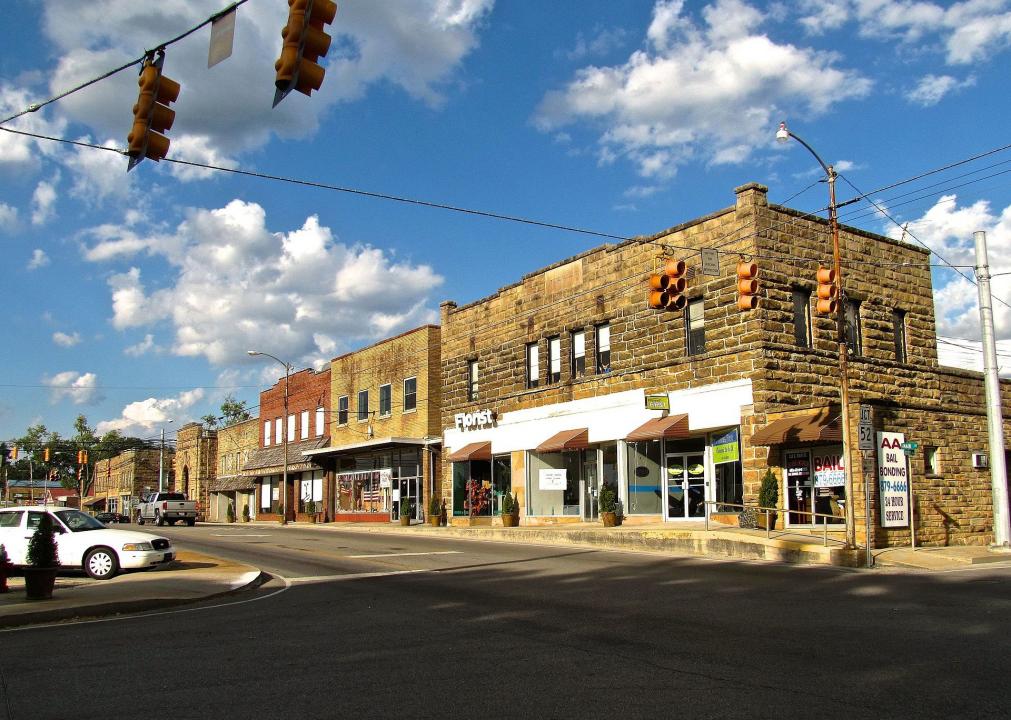
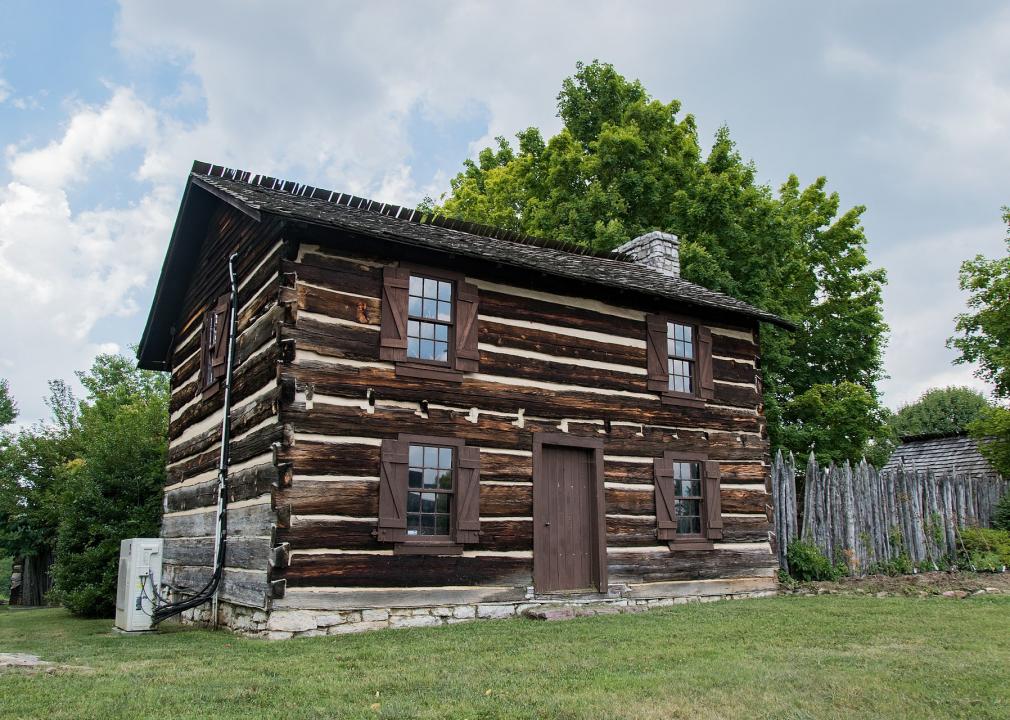
#49. Johnson County
- Mean travel time to work: 27.4- Workers with 60+ minute commute: 10.3%
- Worked outside of county of residence: 11.2%
Walker Kinsler // Wikimedia Commons
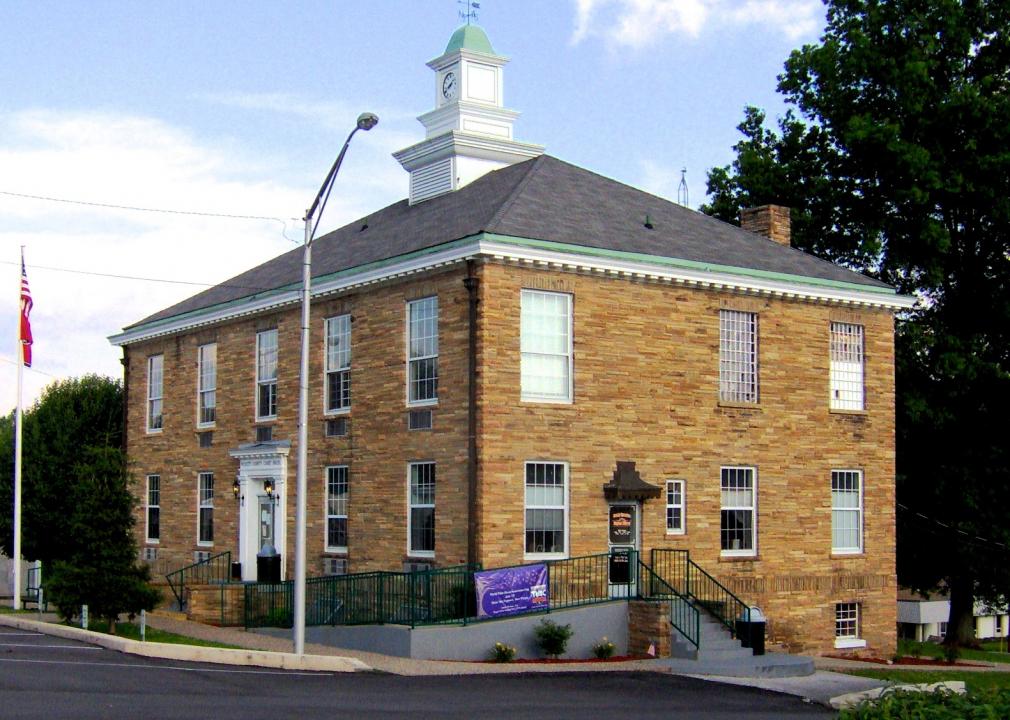
#48. Hawkins County
- Mean travel time to work: 27.4- Workers with 60+ minute commute: 8.1%
- Worked outside of county of residence: 49.5%
Brian Stansberry // Wikimedia Commons
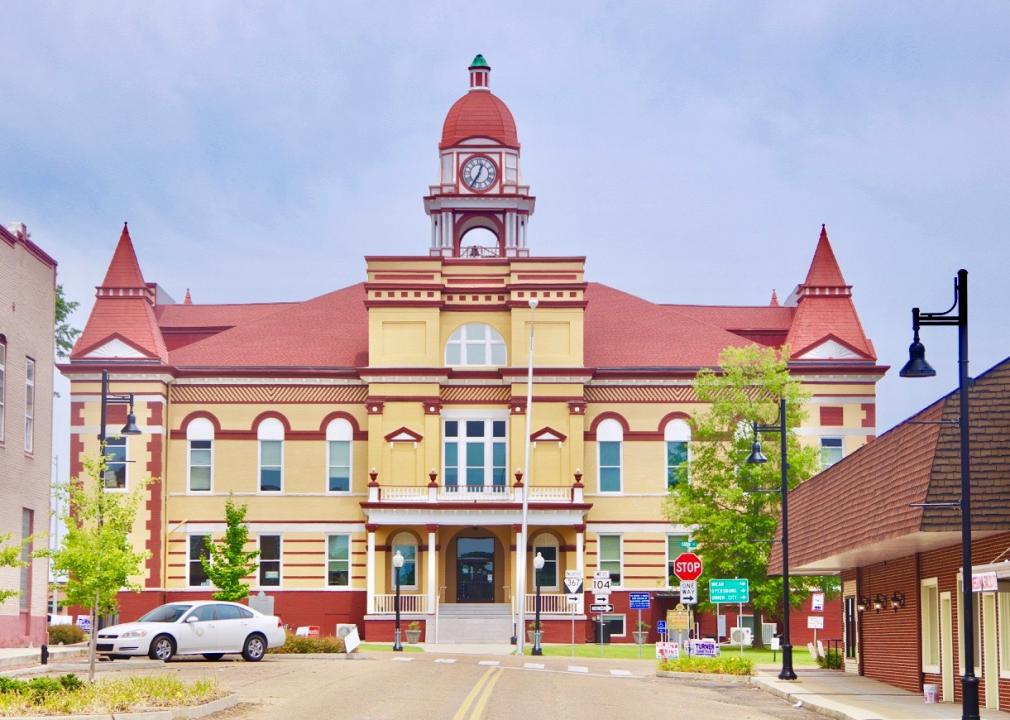
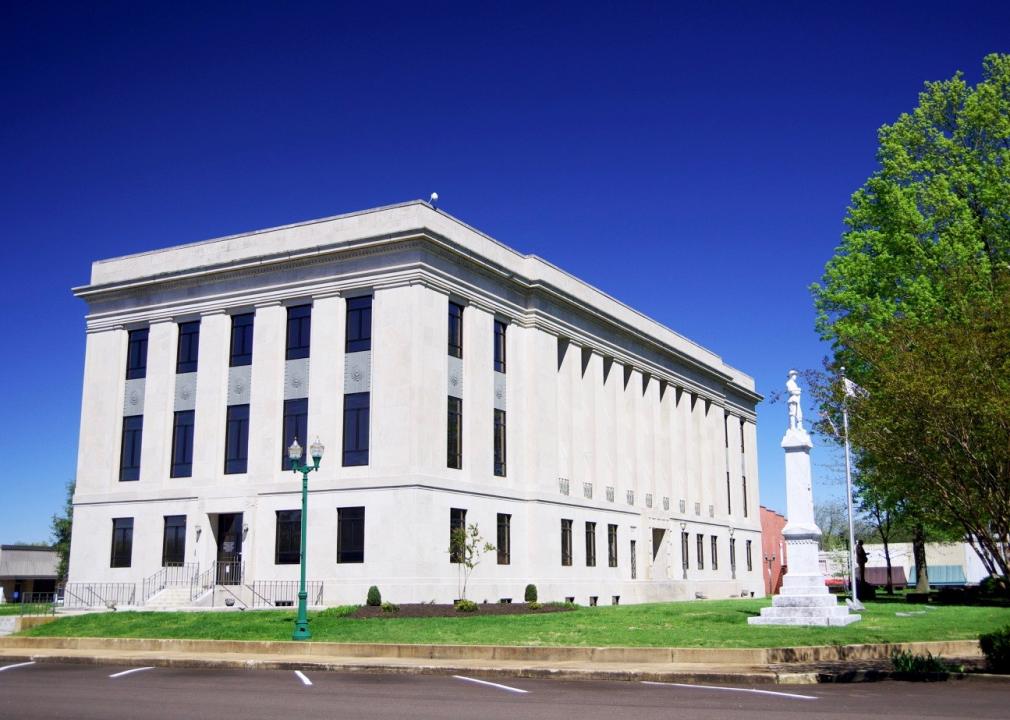
#47. Scott County
- Mean travel time to work: 27.0- Workers with 60+ minute commute: 16.0%
- Worked outside of county of residence: 19.7%
Brian Stansberry // Wikimedia Commons
#46. Pickett County
- Mean travel time to work: 26.8- Workers with 60+ minute commute: 11.1%
- Worked outside of county of residence: 27.2%

Skye Marthaler // Wikimedia Commons
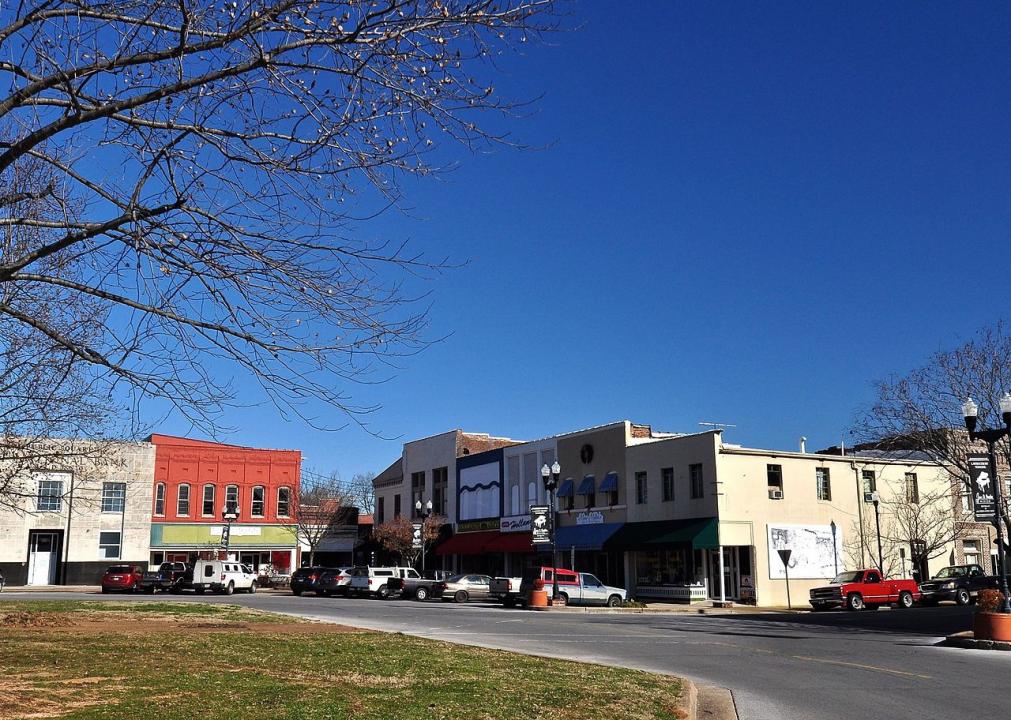
#45. McNairy County
- Mean travel time to work: 26.8- Workers with 60+ minute commute: 7.4%
- Worked outside of county of residence: 34.6%
Canva
#44. Montgomery County
- Mean travel time to work: 26.6- Workers with 60+ minute commute: 10.6%
- Worked outside of county of residence: 15.5%

Canva
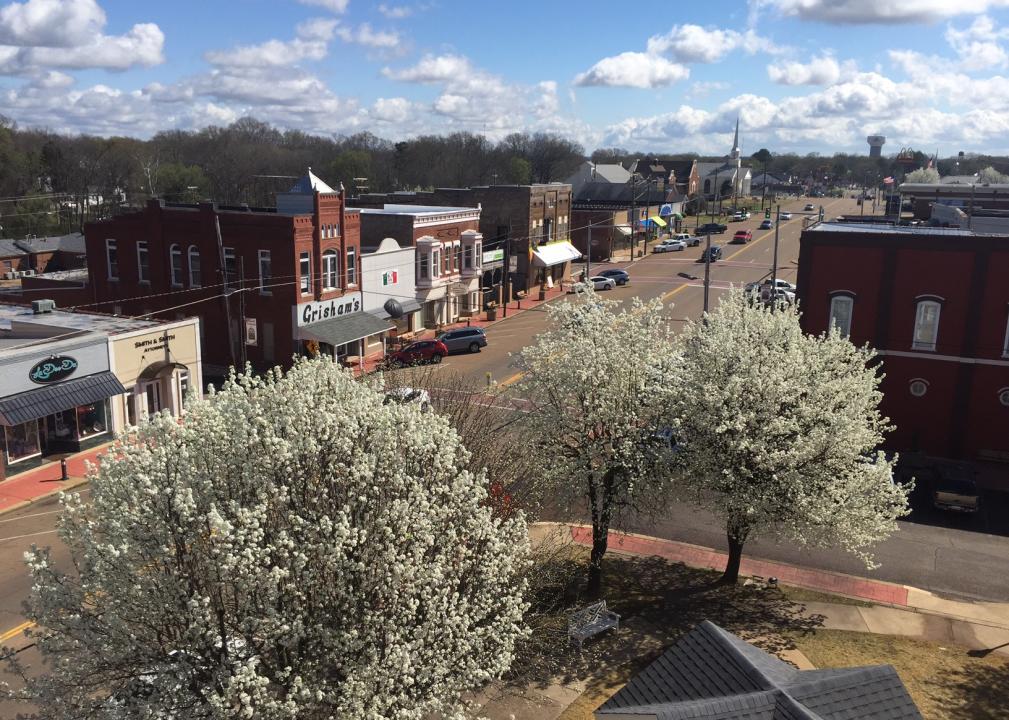
#43. Jefferson County
- Mean travel time to work: 26.6- Workers with 60+ minute commute: 6.8%
- Worked outside of county of residence: 55.8%
Skye Marthaler // Wikimedia Commons
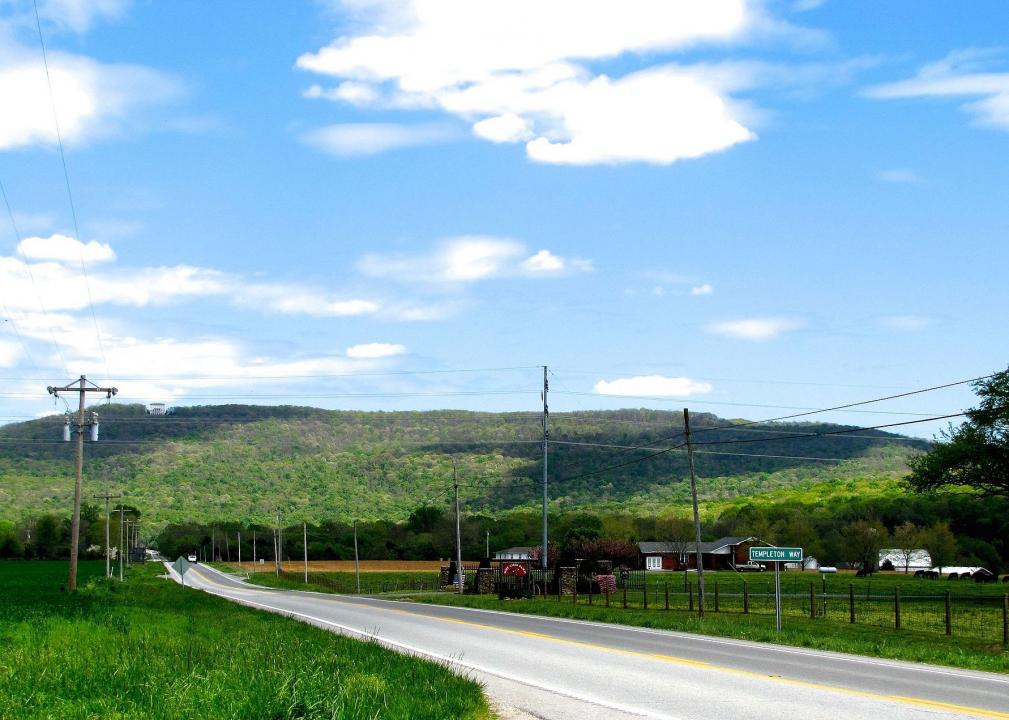
#42. Lawrence County
- Mean travel time to work: 26.4- Workers with 60+ minute commute: 10.1%
- Worked outside of county of residence: 27.0%
Brian Stansberry // Wikimedia Commons
#41. Rhea County
- Mean travel time to work: 26.2- Workers with 60+ minute commute: 11.7%
- Worked outside of county of residence: 31.5%
Canva
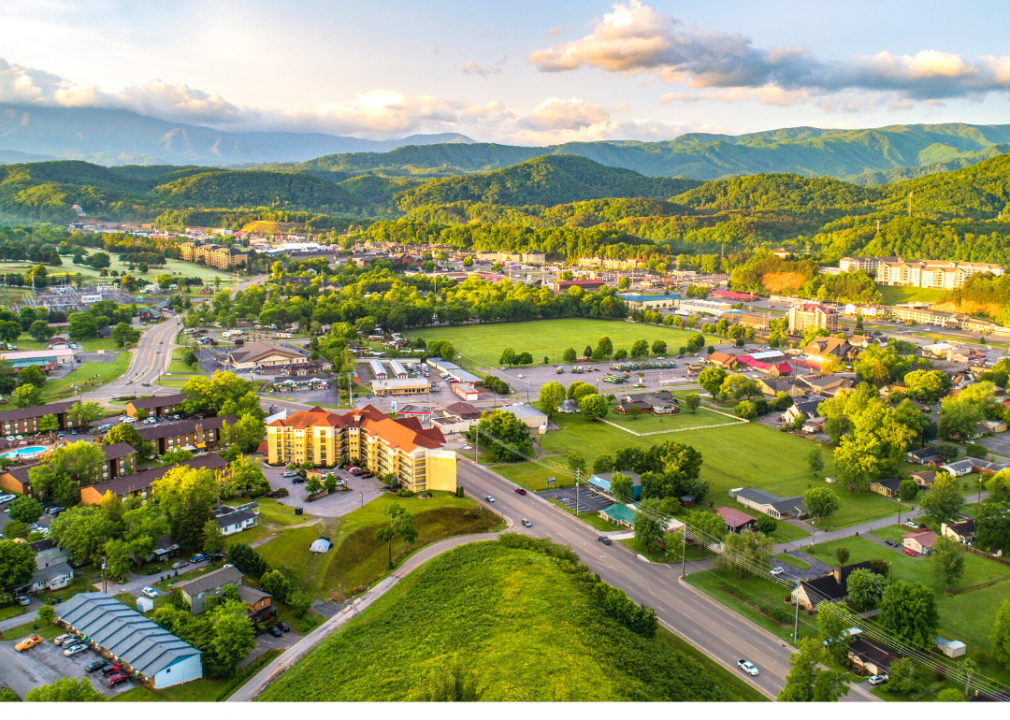
#40. Sevier County
- Mean travel time to work: 26.2- Workers with 60+ minute commute: 6.1%
- Worked outside of county of residence: 21.1%
Brian Stansberry // Wikimedia Commons
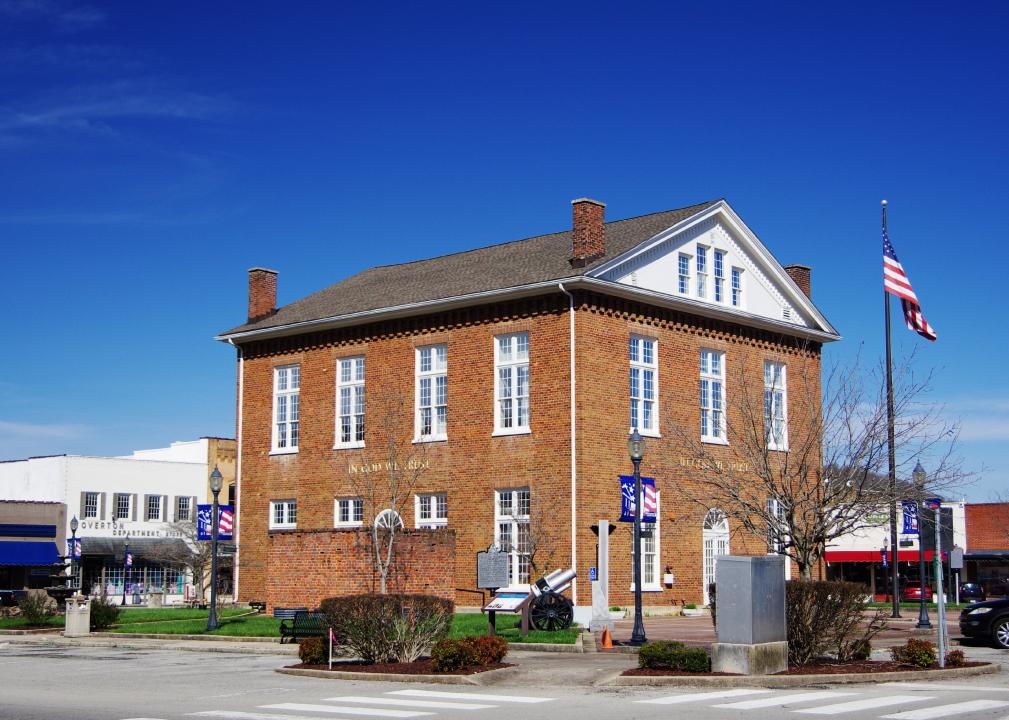
#39. Overton County
- Mean travel time to work: 26.1- Workers with 60+ minute commute: 5.3%
- Worked outside of county of residence: 46.9%

Ichabod // Wikimedia Commons
#38. Bedford County
- Mean travel time to work: 25.7- Workers with 60+ minute commute: 9.4%
- Worked outside of county of residence: 39.2%
Brian Stansberry // Wikimedia Commons
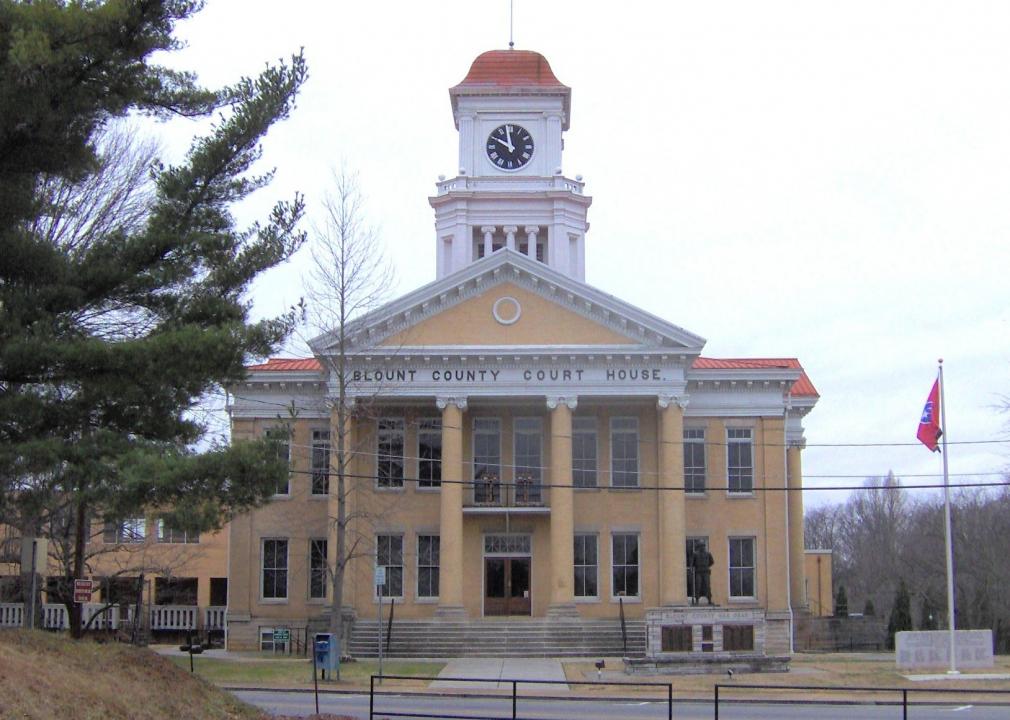
#37. Blount County
- Mean travel time to work: 25.7- Workers with 60+ minute commute: 5.4%
- Worked outside of county of residence: 34.8%
Brian Stansberry // Wikimedia Commons
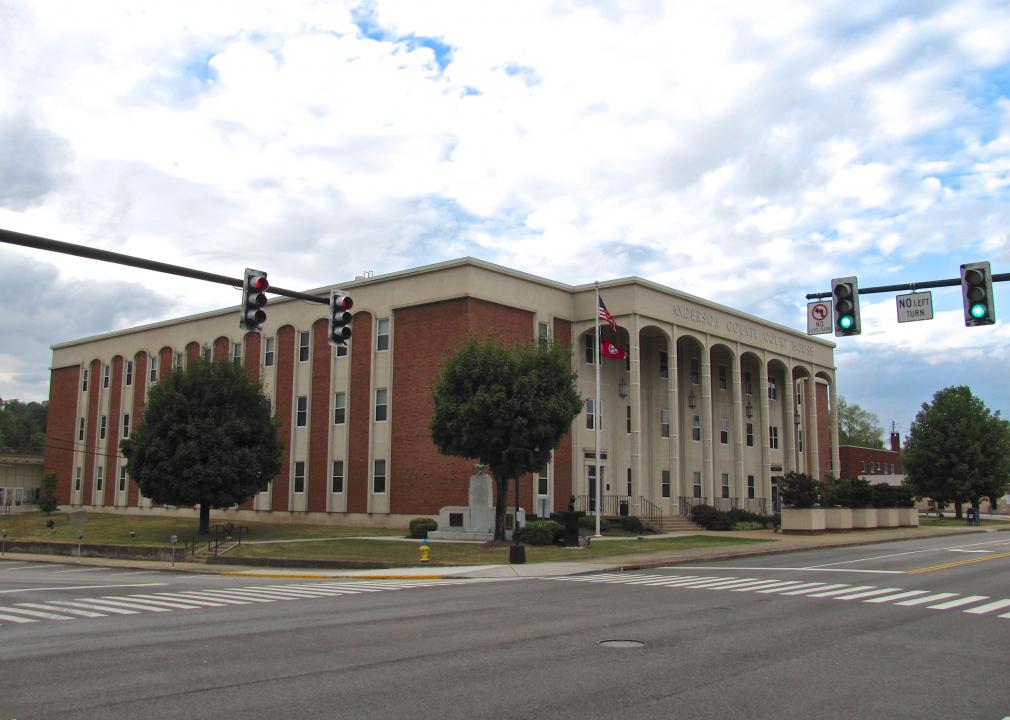
#36. Anderson County
- Mean travel time to work: 25.7- Workers with 60+ minute commute: 4.6%
- Worked outside of county of residence: 42.3%
Brian Stansberry // Wikimedia Commons
#35. Gibson County
- Mean travel time to work: 25.6- Workers with 60+ minute commute: 5.9%
- Worked outside of county of residence: 50.0%
Thomas R Machnitzki (thomasmachnitzki.com) // Wikimedia Commons
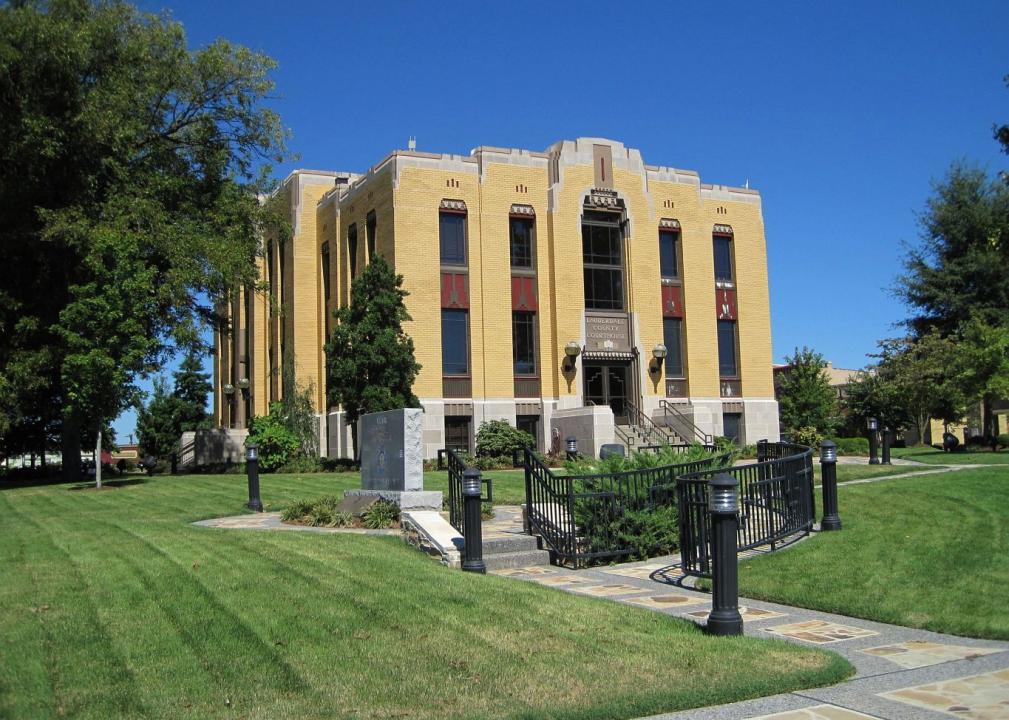
#34. Lauderdale County
- Mean travel time to work: 25.5- Workers with 60+ minute commute: 12.4%
- Worked outside of county of residence: 38.2%
Brian Stansberry // Wikimedia Commons
#33. Warren County
- Mean travel time to work: 25.5- Workers with 60+ minute commute: 11.4%
- Worked outside of county of residence: 27.2%
Brian Stansberry // Wikimedia Commons
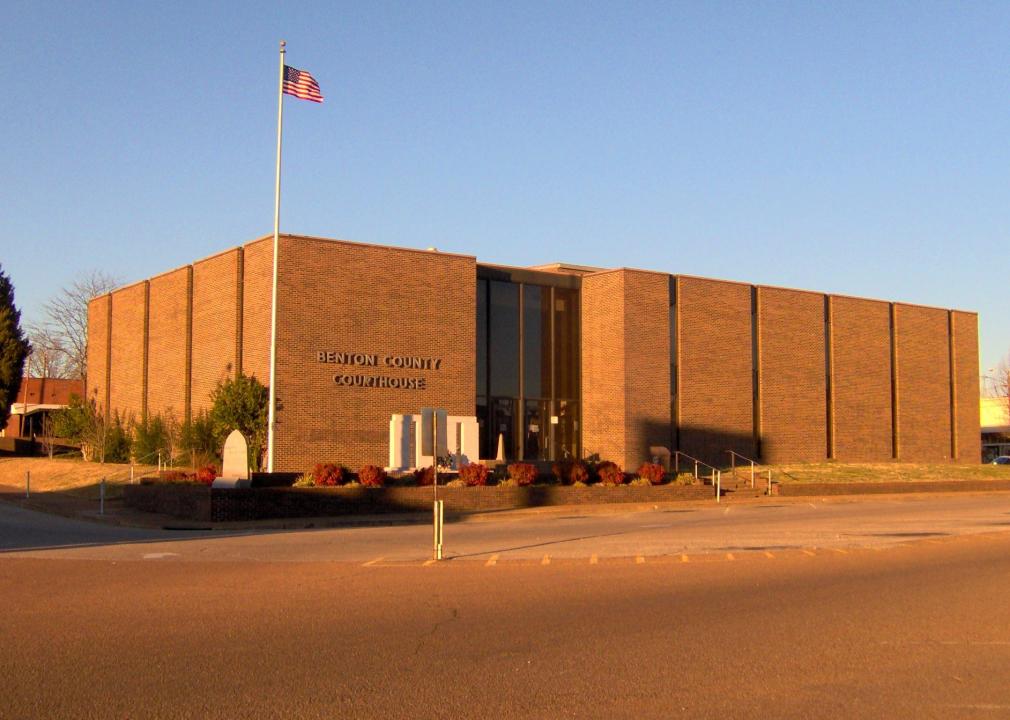
#32. Benton County
- Mean travel time to work: 25.5- Workers with 60+ minute commute: 8.6%
- Worked outside of county of residence: 41.5%

Canva
#31. Haywood County
- Mean travel time to work: 25.4- Workers with 60+ minute commute: 9.2%
- Worked outside of county of residence: 43.7%
Brian Stansberry // Wikimedia Commons
#30. Claiborne County
- Mean travel time to work: 25.3- Workers with 60+ minute commute: 11.6%
- Worked outside of county of residence: 19.6%
Brian Stansberry // Wikimedia Commons
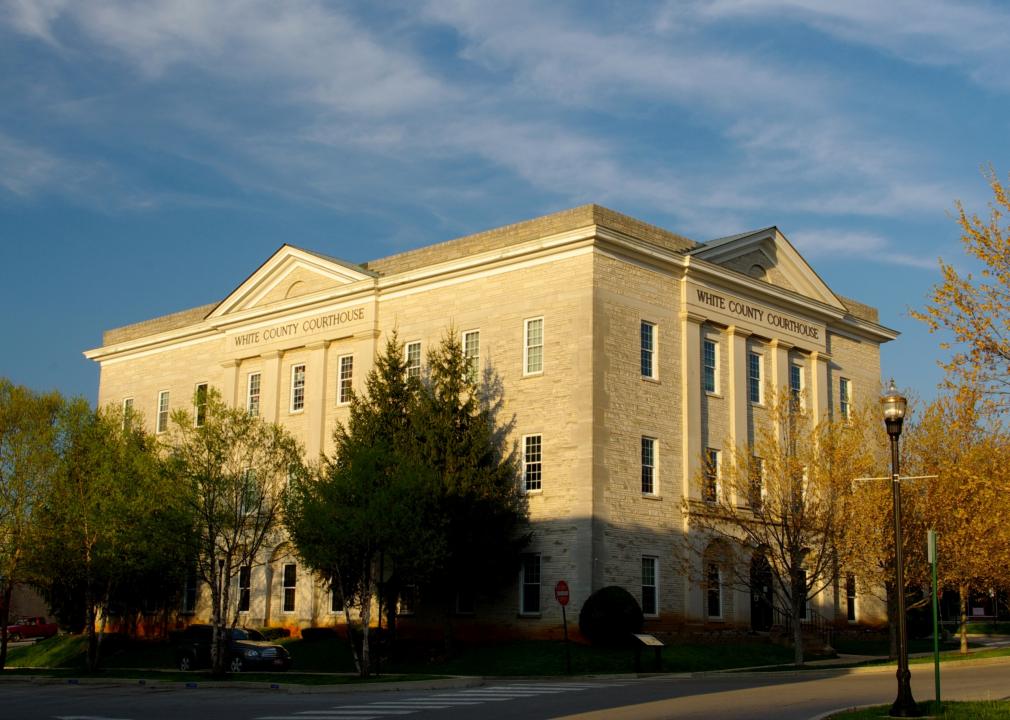
#29. White County
- Mean travel time to work: 25.3- Workers with 60+ minute commute: 8.6%
- Worked outside of county of residence: 49.0%
Brian Stansberry // Wikimedia Commons
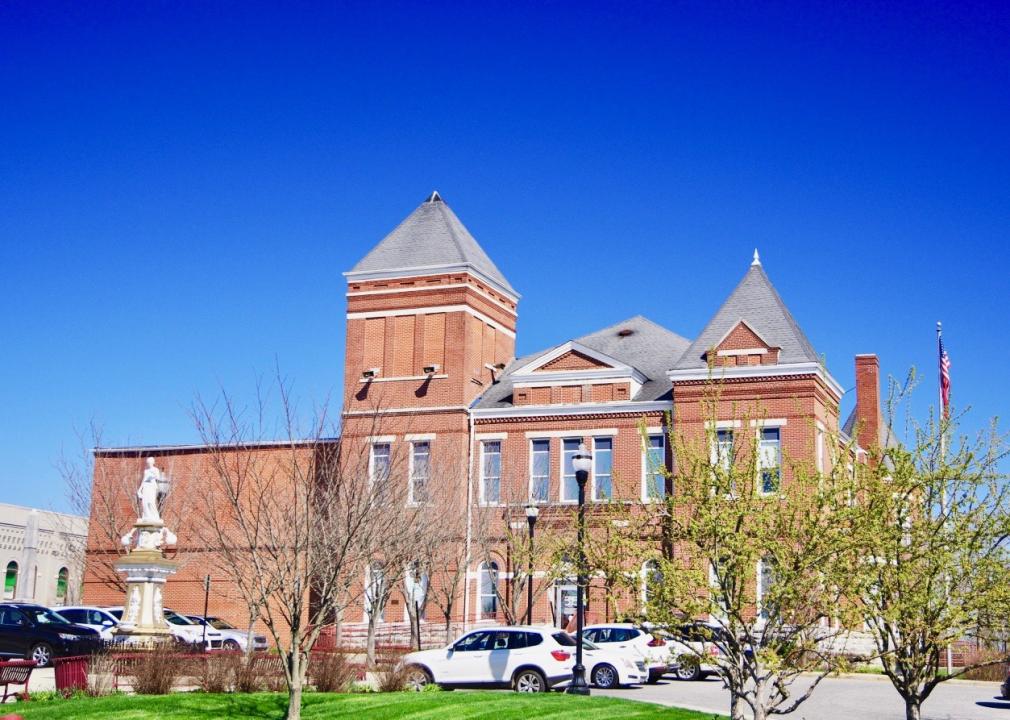
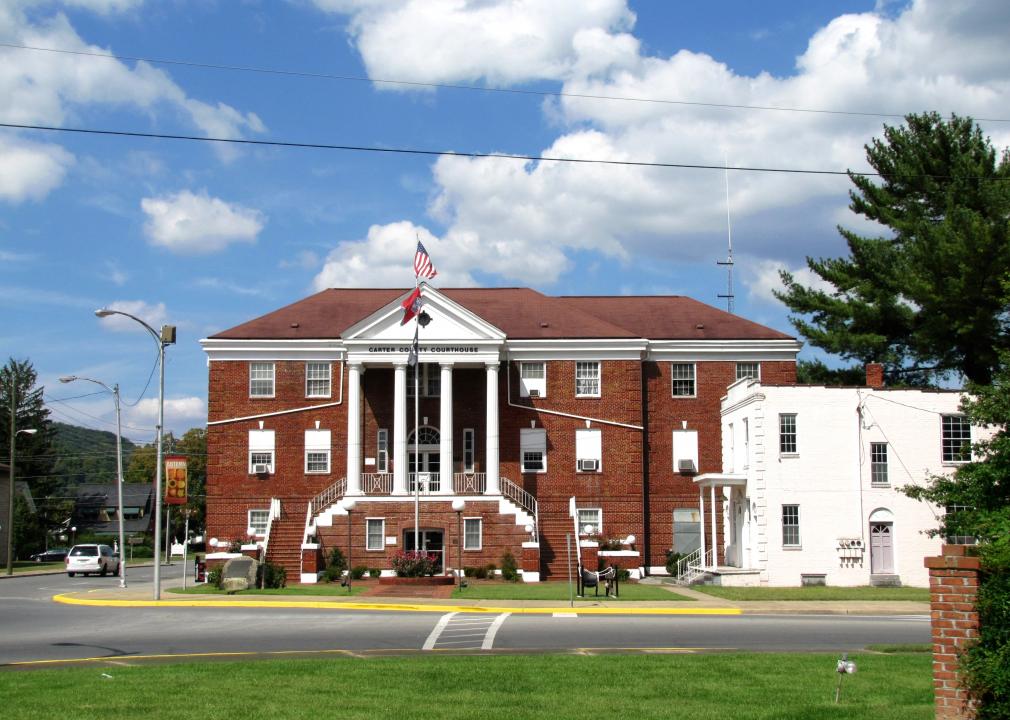
#28. Carter County
- Mean travel time to work: 24.9- Workers with 60+ minute commute: 5.6%
- Worked outside of county of residence: 51.8%

Canva
#27. Davidson County
- Mean travel time to work: 24.9- Workers with 60+ minute commute: 5.1%
- Worked outside of county of residence: 15.2%
Nyttend // Wikimedia Commons
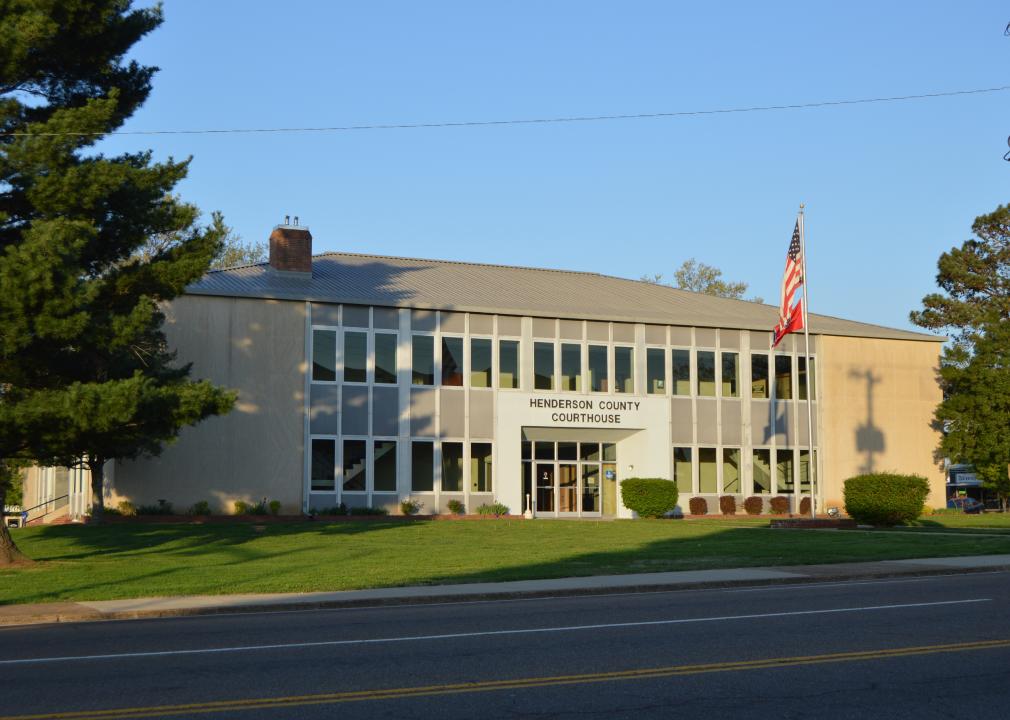
#26. Henderson County
- Mean travel time to work: 24.8- Workers with 60+ minute commute: 6.6%
- Worked outside of county of residence: 37.3%
Brian Stansberry // Wikimedia Commons
#25. Fentress County
- Mean travel time to work: 24.2- Workers with 60+ minute commute: 8.1%
- Worked outside of county of residence: 30.2%
Brian Stansberry // Wikimedia Commons
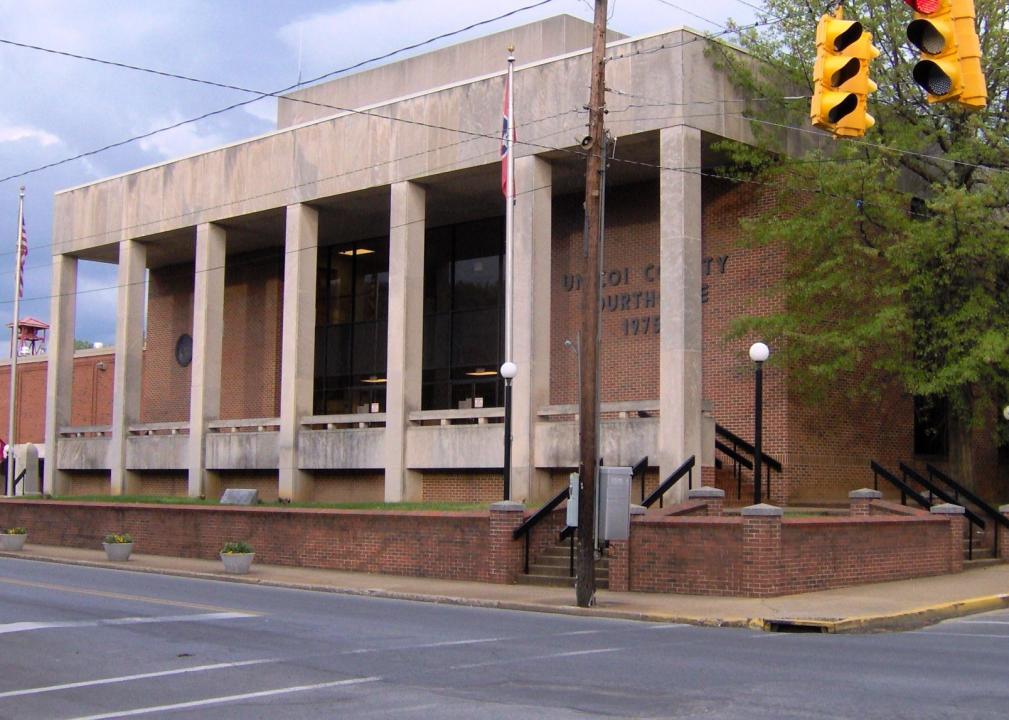
#24. Unicoi County
- Mean travel time to work: 24.1- Workers with 60+ minute commute: 6.8%
- Worked outside of county of residence: 51.5%
Brian Stansberry // Wikimedia Commons
#23. Coffee County
- Mean travel time to work: 24.0- Workers with 60+ minute commute: 7.8%
- Worked outside of county of residence: 29.8%
Brian Stansberry // Wikimedia Commons
#22. Crockett County
- Mean travel time to work: 23.8- Workers with 60+ minute commute: 5.4%
- Worked outside of county of residence: 60.5%
Ballinindasierra // Wikimedia Commons
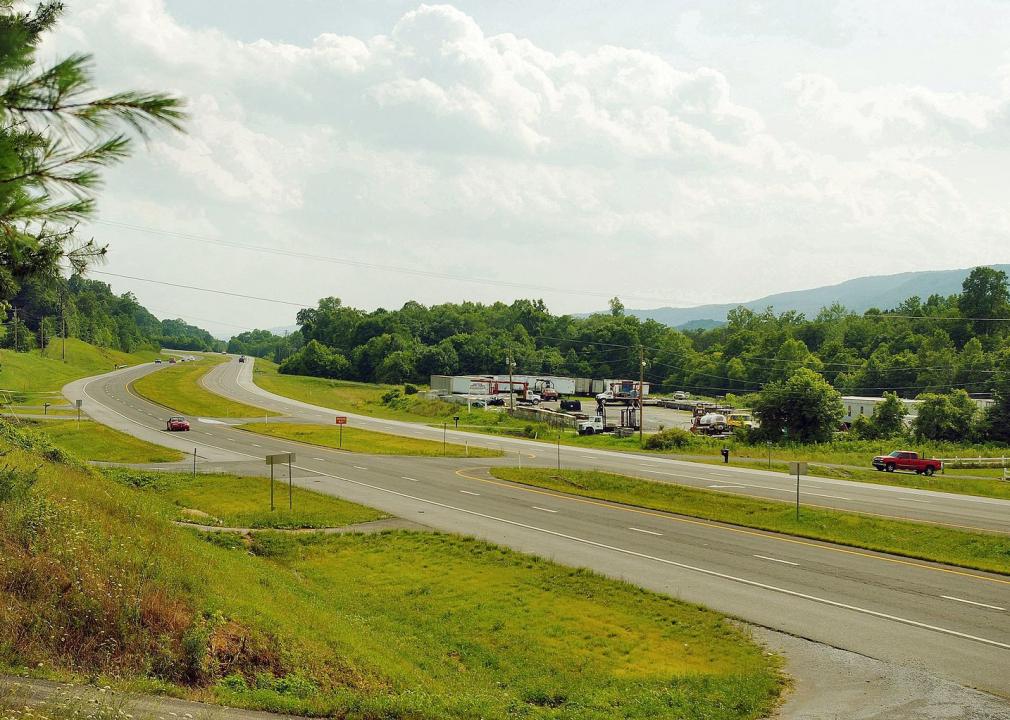
#21. Hardin County
- Mean travel time to work: 23.5- Workers with 60+ minute commute: 9.3%
- Worked outside of county of residence: 19.6%
Brian Stansberry // Wikimedia Commons
#20. Franklin County
- Mean travel time to work: 23.3- Workers with 60+ minute commute: 6.3%
- Worked outside of county of residence: 36.7%
AppalachianCentrist // Wikimedia Commons
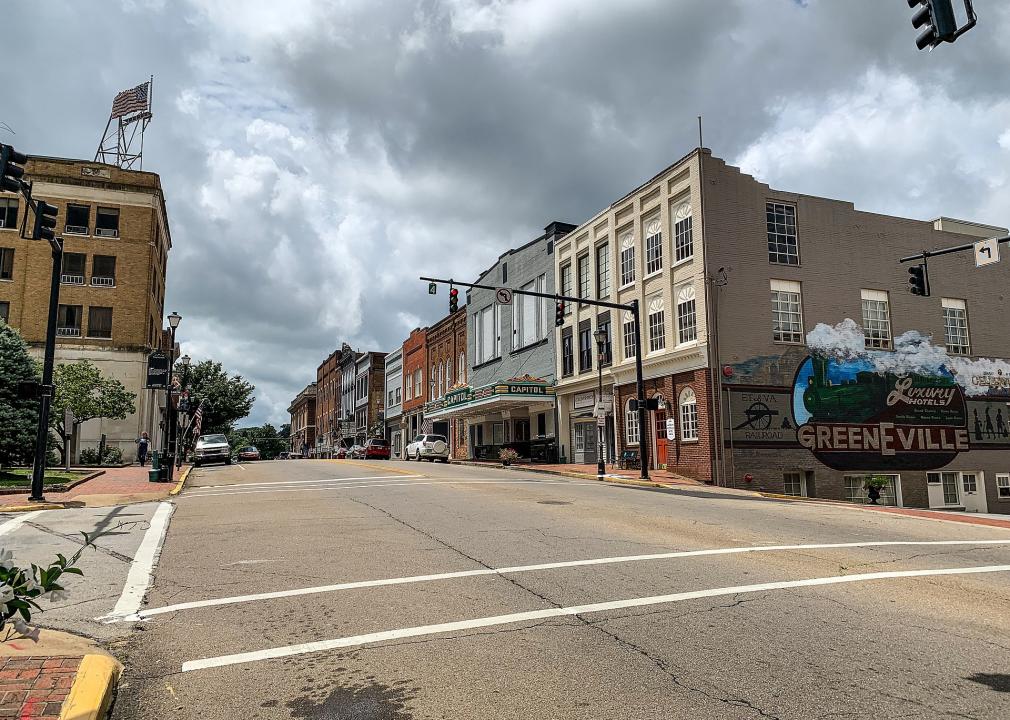
#19. Greene County
- Mean travel time to work: 23.2- Workers with 60+ minute commute: 4.6%
- Worked outside of county of residence: 21.5%
Brian Stansberry // Wikimedia Commons
#18. Cumberland County
- Mean travel time to work: 22.8- Workers with 60+ minute commute: 6.6%
- Worked outside of county of residence: 13.9%

Canva
#17. Shelby County
- Mean travel time to work: 22.8- Workers with 60+ minute commute: 2.7%
- Worked outside of county of residence: 1.0%
Brian Stansberry // Wikimedia Commons
#16. McMinn County
- Mean travel time to work: 22.7- Workers with 60+ minute commute: 6.3%
- Worked outside of county of residence: 34.9%
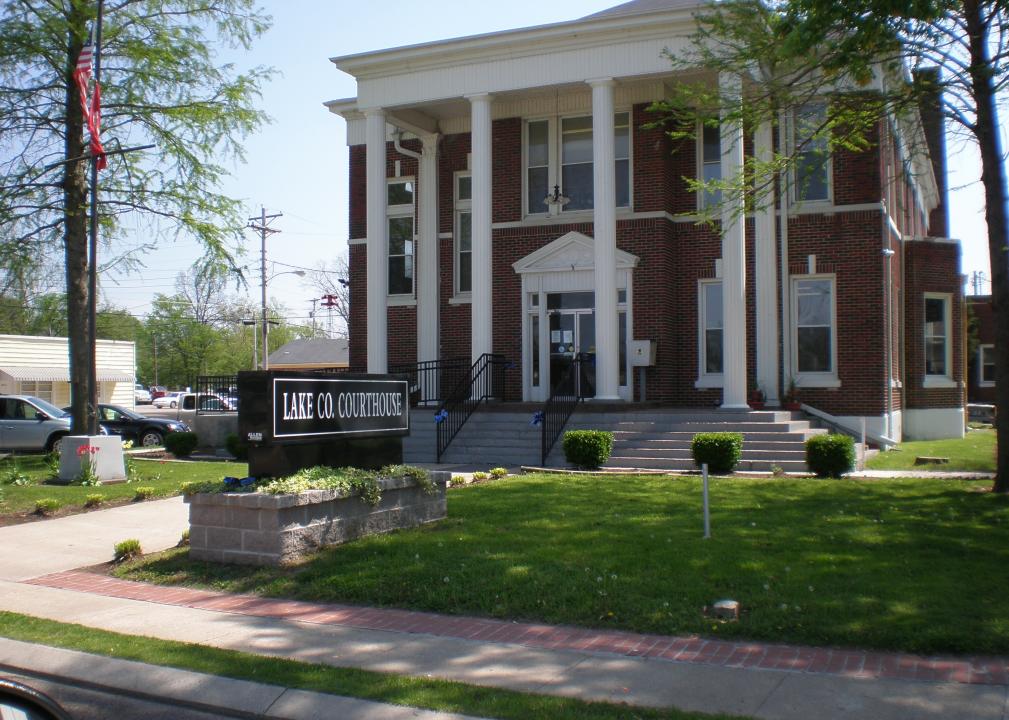
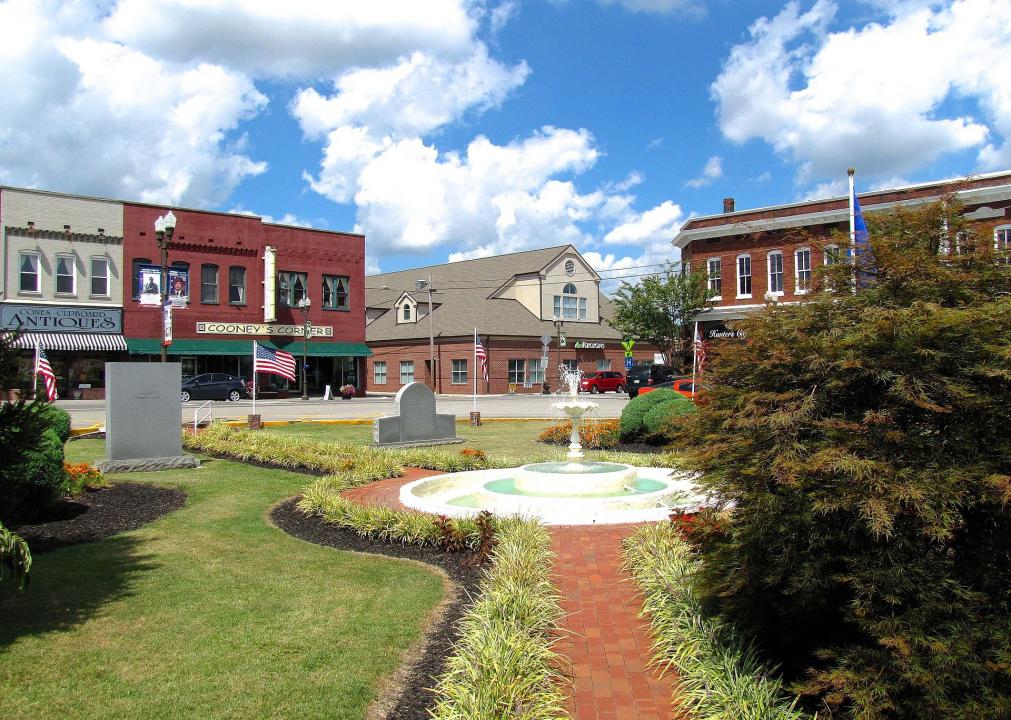
Flickr user chiacomo // Wikimedia Commons
#15. Lake County
- Mean travel time to work: 22.7- Workers with 60+ minute commute: 6.2%
- Worked outside of county of residence: 42.3%
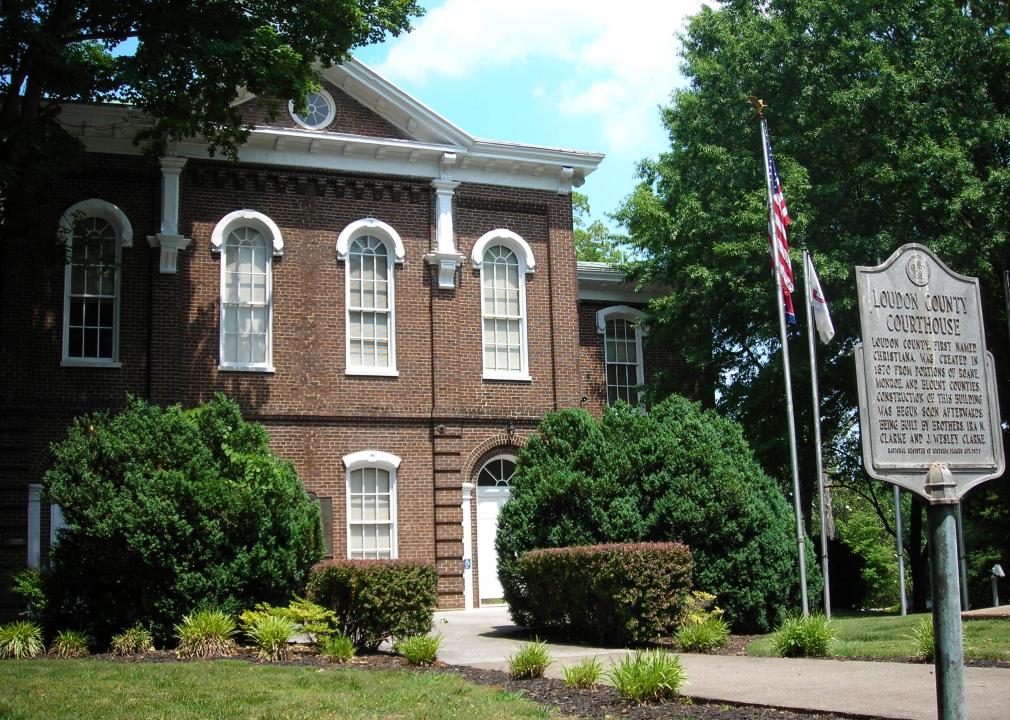
Scott Basford // Wikimedia Commons
#14. Loudon County
- Mean travel time to work: 22.7- Workers with 60+ minute commute: 2.8%
- Worked outside of county of residence: 46.6%
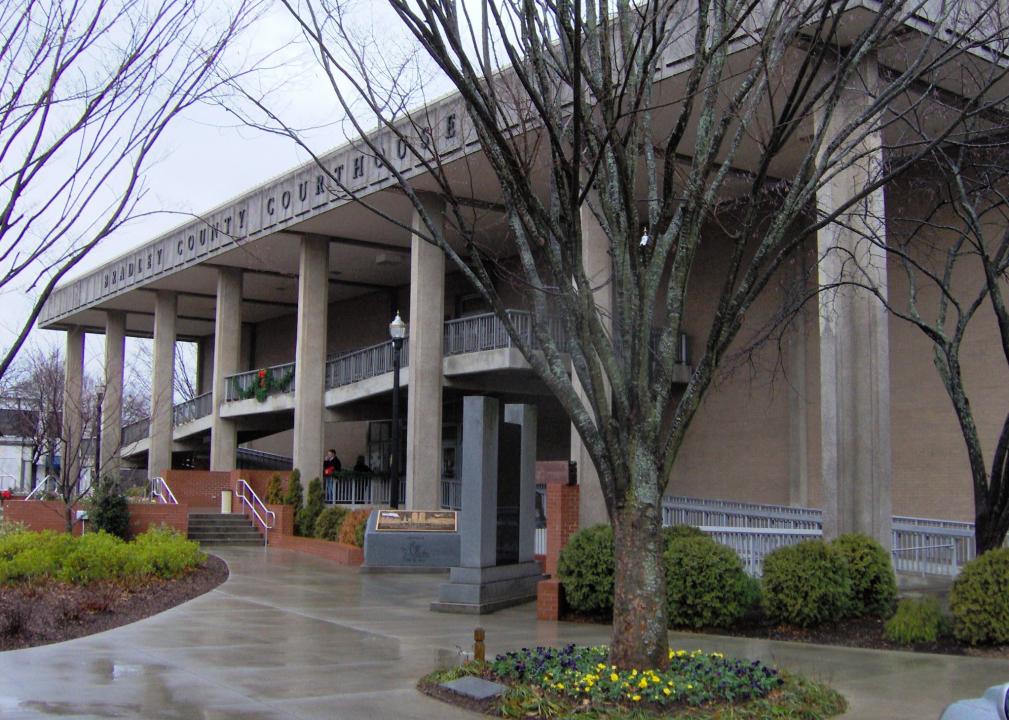
Brian Stansberry // Wikimedia Commons
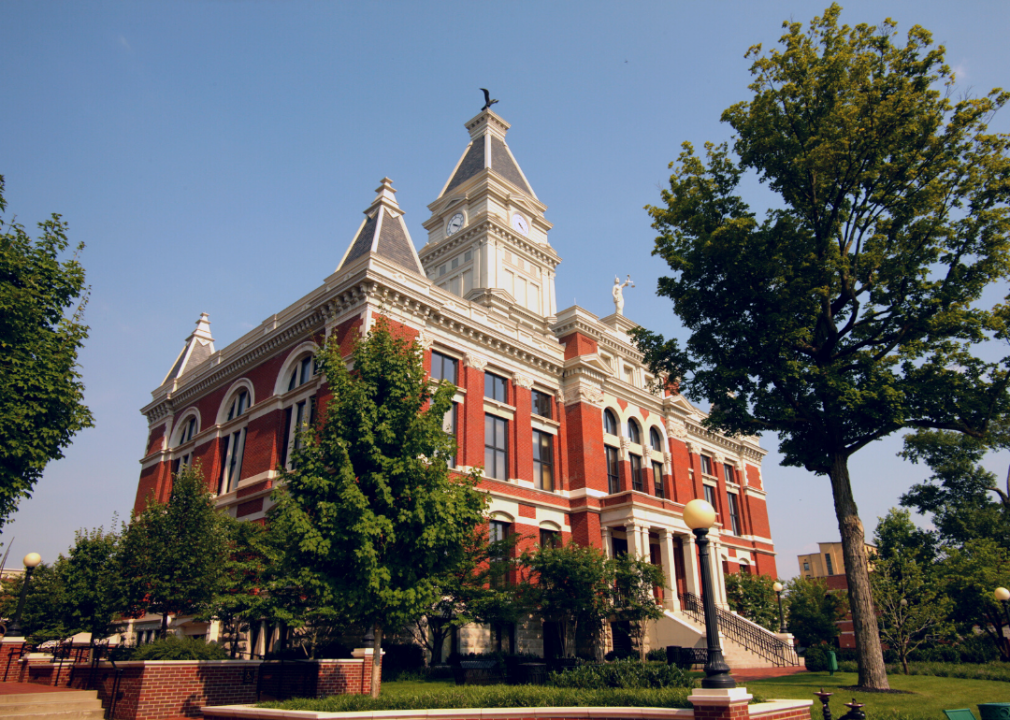
#13. Bradley County
- Mean travel time to work: 22.2- Workers with 60+ minute commute: 4.0%
- Worked outside of county of residence: 22.5%
Ɱ // Wikimedia Commons
#12. Knox County
- Mean travel time to work: 22.2- Workers with 60+ minute commute: 3.0%
- Worked outside of county of residence: 15.3%
Brian Stansberry // Wikimedia Commons
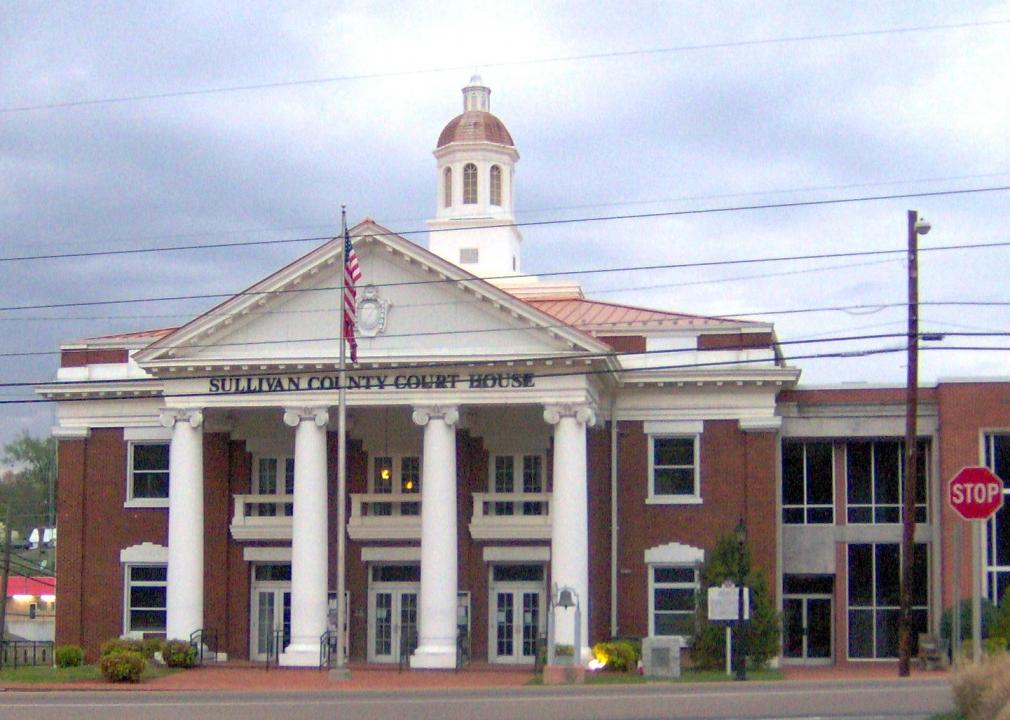
#11. Sullivan County
- Mean travel time to work: 21.9- Workers with 60+ minute commute: 3.8%
- Worked outside of county of residence: 19.6%

Brian Stansberry // Wikimedia Commons
#10. Hamilton County
- Mean travel time to work: 21.7- Workers with 60+ minute commute: 2.8%
- Worked outside of county of residence: 4.2%
Brian Stansberry // Wikimedia Commons
#9. Putnam County
- Mean travel time to work: 21.6- Workers with 60+ minute commute: 7.1%
- Worked outside of county of residence: 15.2%

Cj4258 // Wikimedia Commons
#8. Henry County
- Mean travel time to work: 21.6- Workers with 60+ minute commute: 6.3%
- Worked outside of county of residence: 11.6%
Brian Stansberry // Wikimedia Commons
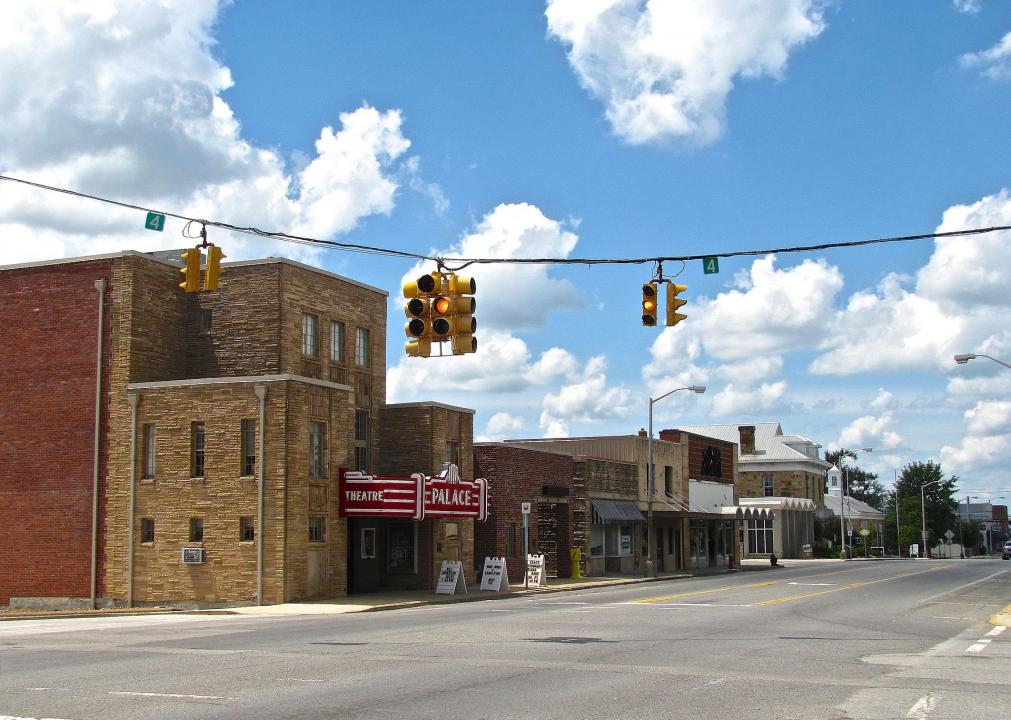
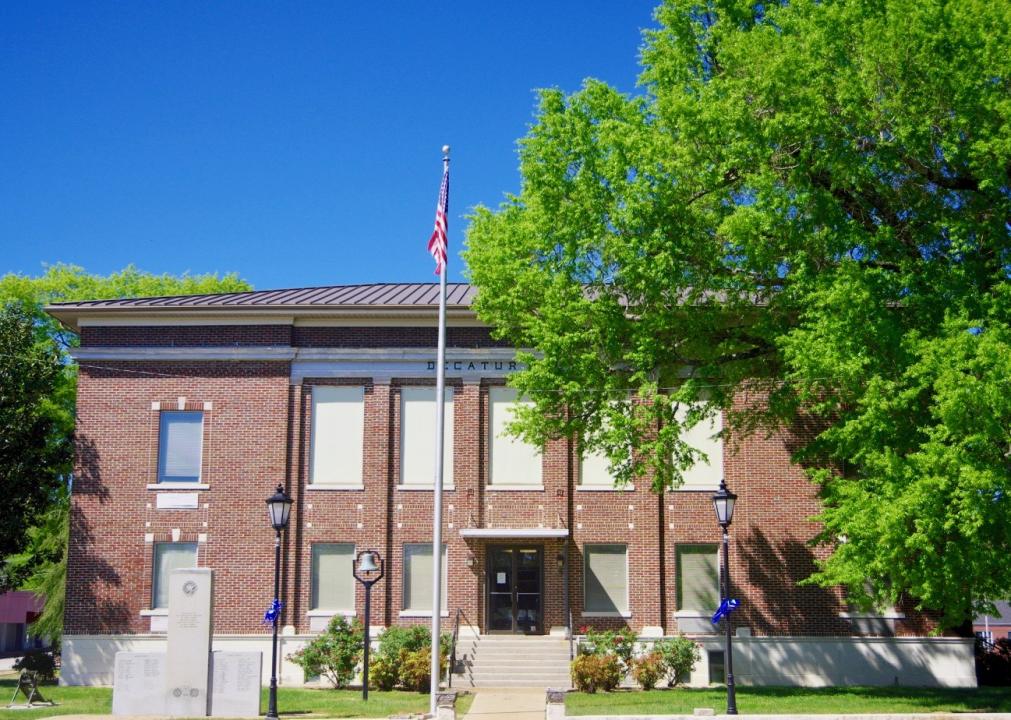
#7. Decatur County
- Mean travel time to work: 21.5- Workers with 60+ minute commute: 5.9%
- Worked outside of county of residence: 31.9%
Brian Stansberry // Wikimedia Commons
#6. Weakley County
- Mean travel time to work: 21.4- Workers with 60+ minute commute: 6.4%
- Worked outside of county of residence: 30.4%
Brian Stansberry // Wikimedia Commons
#5. Washington County
- Mean travel time to work: 21.4- Workers with 60+ minute commute: 3.7%
- Worked outside of county of residence: 24.3%
AppalachianCentrist // Wikimedia Commons
#4. Hamblen County
- Mean travel time to work: 21.0- Workers with 60+ minute commute: 6.8%
- Worked outside of county of residence: 25.6%
GamblinMonkey // Wikimedia Commons
#3. Dyer County
- Mean travel time to work: 21.0- Workers with 60+ minute commute: 5.8%
- Worked outside of county of residence: 17.5%
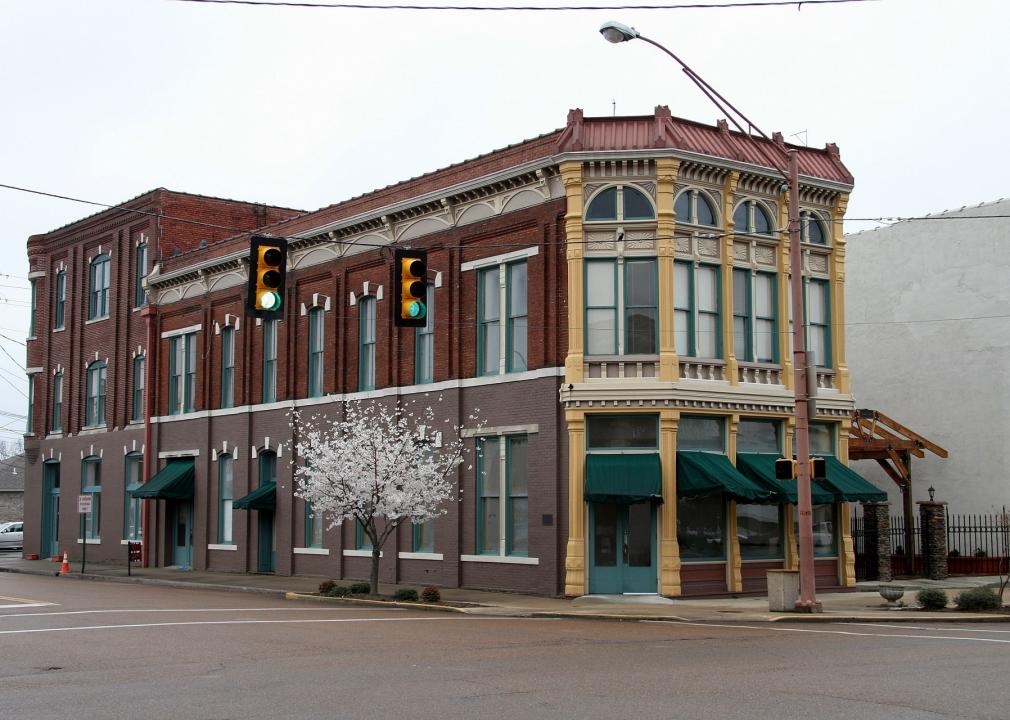
Thomas R Machnitzki (thomasmachnitzki.com) // Wikimedia Commons
#2. Obion County
- Mean travel time to work: 20.3- Workers with 60+ minute commute: 4.5%
- Worked outside of county of residence: 19.9%

Canva
#1. Madison County
- Mean travel time to work: 19.2- Workers with 60+ minute commute: 4.3%
- Worked outside of county of residence: 10.0%